It’s been over a year since we launched our remote dev environment (called internally dev-sync) and we are loving it. But it wouldn’t be a true piece of software if it didn’t go through numerous iterations.
The first version of dev-sync solved our most pending needs: reducing the CPU load and memory usage. It improved our dev experience tremendously, but we lacked observability over the remote instances and commands. Having observability and commands would make it a one-stop tool and ease our day-to-day tasks. In this post, we’ll discuss what the dev-sync evolved into and why.
From Command to a Dashboard
Before mentioning anything else, we should briefly discuss how the dev-sync works. With our custom mixmax cli, every new dev can simply run a command to set up their remote instance that spawns all relevant services. Once the instance is up, the dev-sync command takes care of watching over file changes and installing dependencies when necessary.
While all this worked seamlessly, we were missing a more visual output on what was happening. The dev-sync would spit out many logs and it was difficult to see the status of ongoing tasks.
Moreover, unless you were connected to the remote instance, it was impossible to tell if all services were working correctly or if your instance was pushed to the limits.
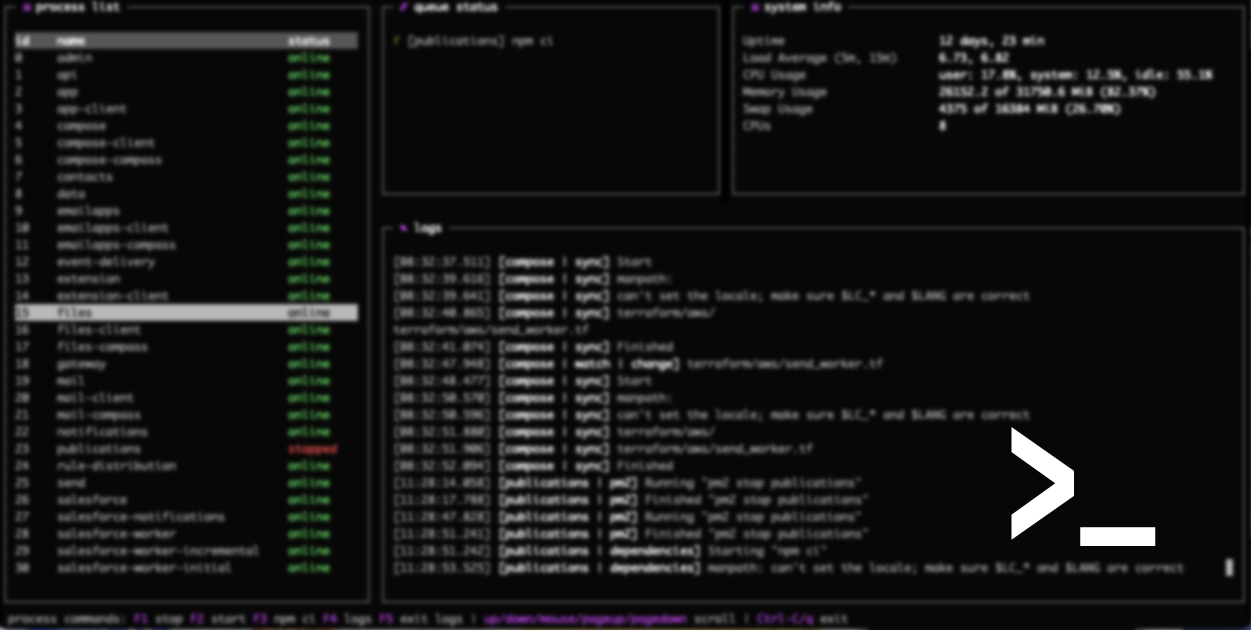
With this in mind, we transformed the sync command into a dashboard.
Observability
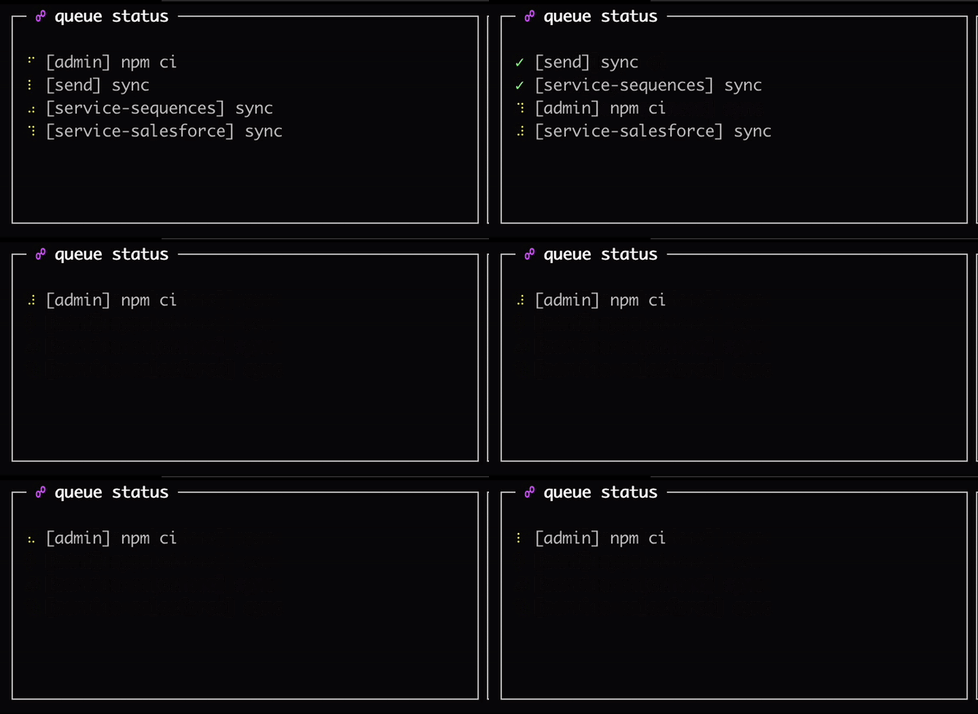
The first thing we decided to add was a queue status. This section lists all services that are in the queue to be processed, either for synchronizing the files or to install the dependencies. Visually, we represent the ongoing action with a spinner and a checkmark once the task is done.

To monitor the health of the remote instance, we brought up the system information stats to our dashboard, too. This way, we can see more easily if a new change is overworking our instance and act on it immediately.
Efficiency
Not all changes we’ve done were visible, though. If you remember at the time of launching the remote environment, we already had in mind to optimize the cost by stopping the instances when they’re not in use. This is now in place, and at the time of running the sync command, we start the instance again.
Other unseen improvements might be small, but are still relevant. We updated code to stop services before certain operations to prevent constant restarting and swallowing our resources until ready. Similarly, where by our architecture we needed to restart a service in order to apply changes from another one, we automated that process, too.
Lastly, we are now running everything with PM2, which better suits our growing needs.
Management
Speaking of PM2, it was clear to us that making its features available from the dashboard would be a great help for the day-to-day coding.
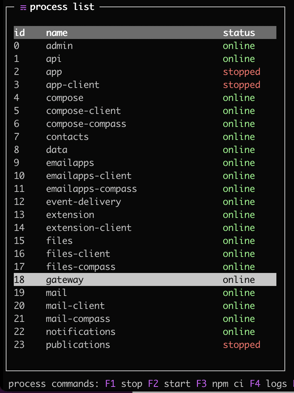
Without leaving the dev-sync dashboard, our developers can not only see the list of processes running on their remote instance with their statuses (with a custom crashing status, too!), but also have the possibility to stop, start, log, or run npm ci on each service, as well.

Version 3?
While for now we don’t have any immediate plans to introduce major changes to the dev-sync tool, we are always on the lookout to optimize our costs and automate repetitive tasks.
Perhaps in the future the sync tool will suggest to update itself when a new version is available. Or, it will automatically downsize instances of devs whose work is less demanding in terms of resources. The only thing we know for sure is that we are not going back—the remote dev environment is here to stay.
Interested in improving our remote dev environment? Visit Mixmax Careers.


